Plain-text diagrams take shape in Asciidoctor!
by -
You write in plain text. You code in plain text. How about creating diagrams in plain text too? Now you can using Asciidoctor Diagram!
Introduction
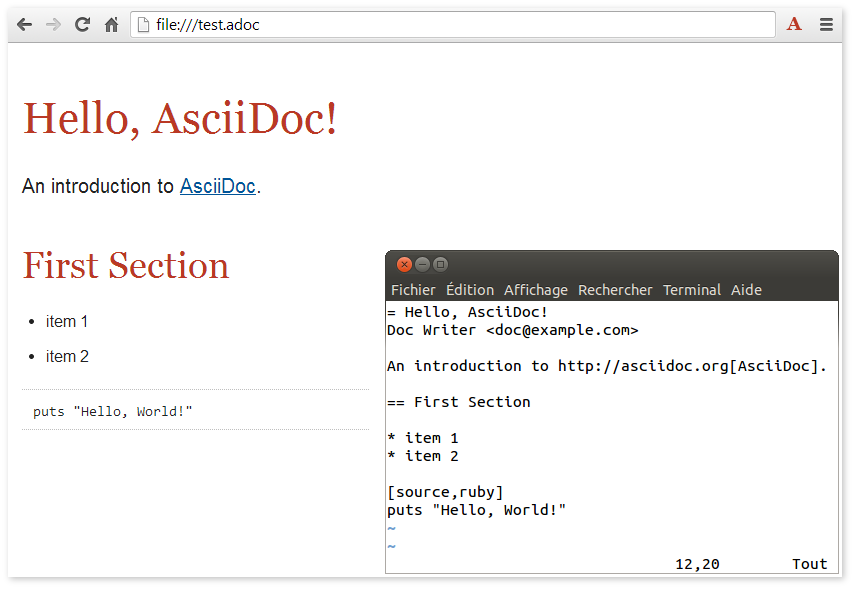
Asciidoctor is a fantastic tool to use when writing technical documentation. It allows you to spend more time focusing on your content rather than struggling with WYSIWYG tools.
One task that still pulls your focus away, and is more difficult than it should be, is integrating technical diagrams into your documents. It involves launching a UML or diagramming tool, pushing pixels around the screen to draw the diagrams, exporting the result to a web-friendly image format and linking to them from your source document. The many benefits that AsciiDoc provides in terms of visual consistency, ease of collaboration, etc. are not available when you are working with diagrams.
All that changes today with the announcement of the Asciidoctor Diagram extension. Asciidoctor Diagram integrates existing plain text syntax diagramming tools into the Asciidoctor processing. That means you can embed the source code for your diagrams directly into your documents!
The first version of Asciidoctor Diagram supports the following diagram languages:
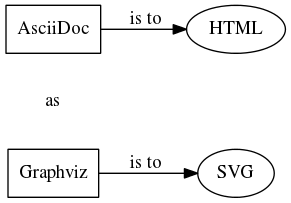
These “lightweight diagram languages” are to graphical diagrams what AsciiDoc is to HTML. Another way of saying it:
Your first plain-text diagram
The simplest way to add diagrams to your documents is by using diagram blocks.
Just add a listing block to your file using the appropriate syntax name (ditaa, graphviz or plantuml) as the block name (aka style).
[ditaa]
----
                   +-------------+
                   | Asciidoctor |-------+
                   |  Diagram    |       |
                   +-------------+       | PNG out
                       ^                 |
                       | ditaa in        |
                       |                 v
 +--------+   +--------+----+    /----------------\
 |        | --+ Asciidoctor +--> |                |
 |  Text  |   +-------------+    |Beautiful output|
 |Document|   |   !magic!   |    |                |
 |     {d}|   |             |    |                |
 +---+----+   +-------------+    \----------------/
     :                                   ^
     |          Lots of work             |
     +-----------------------------------+
----
When the Asciidoctor Diagram extension processes this type of block, it will read the body of the block, pass it to the ditaa library, write the resulting image to disk and generate an image block. Here’s how it appears in the rendered document:
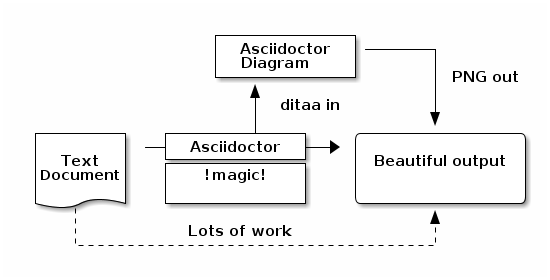
Magic!
Generating one of these images is fairly quick, but if you start adding lots of diagrams to your document the processing time can start adding up. Asciidoctor Diagram optimizes the processing by keeping track of diagram metadata in *.cache files and will only regenerate the images if the diagram source code was modified. This keeps incremental rendering of documents a speedy process.
Controlling the output
By default Asciidoctor Diagram creates PNG images and calculates an output file name automatically based on the diagram source code.
This behavior can be overridden using the target and format attributes.
You can specify these attributes as the first and second positional attributes or as explicitly named attributes.
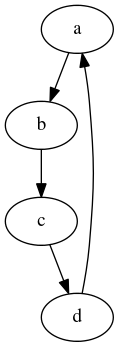
An SVG file with a specific name a Graphviz diagram can be generated as follows
[graphviz, dot-example, svg]
----
digraph g {
    a -> b
    b -> c
    c -> d
    d -> a
}
----
After the magic happens, you’ll see:
Asciidoctor Diagram bundles both the ditaa and PlantUML libraries and will use them to generate diagrams.
In order to generate diagrams using Graphviz, you must install it separately (meaning the dot command must be available on your PATH).
|
Asciidoctor Diagram turns the diagram blocks into image blocks and applies any additional attributes. This means you can use the normal Asciidoctor facilities to control the positioning of the generated image. Block titles and IDs can also be assigned in the same way.
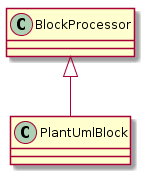
[[main-classes]]
.The PlantUML block extension class
[plantuml, sample-plantuml-diagram, alt="Class diagram", width=135, height=118]
----
class BlockProcessor
class PlantUmlBlock
BlockProcessor <|-- PlantUmlBlock
----
Here’s what gets rendered:
Including external diagrams
It might not always be desirable to embed the source code for diagrams in your document. External diagrams can also be processed using the block macro syntax. This is very similar to how you typically include images in your documents.
plantuml::classes.txt[format=svg, alt="Class diagram", width=300, height=200]Enabling the extension
Asciidoctor 0.1.4 does not yet allow extensions to be enabled via the command line.
That is a feature coming in Asciidoctor 1.5.0.
Until then, the easiest way to enable the extensions is to use a short wrapper script.
The following script, asciidoctor-diagram, loads and registers the Asciidoctor Diagram extension, then invokes Asciidoctor in the same way as the asciidoctor command.
asciidoctor-diagram launch script#!/usr/bin/env ruby
require 'asciidoctor' (1)
require 'asciidoctor/cli/options'
require 'asciidoctor/cli/invoker'
require 'asciidoctor-diagram' (2)
invoker = Asciidoctor::Cli::Invoker.new ARGV (3)
invoker.invoke!
exit invoker.code| 1 | Loads Asciidoctor |
| 2 | Loads and registers the Asciidoctor Diagram extensions |
| 3 | Invoke the Asciidoctor CLI |
Put the asciidoctor-diagram script on your PATH, make it executable and use it in place of the asciidoctor command.
$ asciidoctor-diagram my-doc-with-cool-diagrams.adoc
After running the asciidoctor-diagram script on your document, go check out the cool diagrams it made for you!
Go play!
Now it’s time to go play with Asciidoctor Diagram. Explore what you can do with it and how it can be improved. To help you get started, check out these examples in the Asciidoctor Diagram repository. We look forward to hearing from you on the Asciidoctor discussion list or the Asciidoctor Diagram issue tracker.
Together, we can make diagrams and documentation come to life out of plain ol' text!